What Do You Think Happened?
By Ken Grauer, MD
Professor Emeritus in Family Medicine, College of Medicine, University of Florida
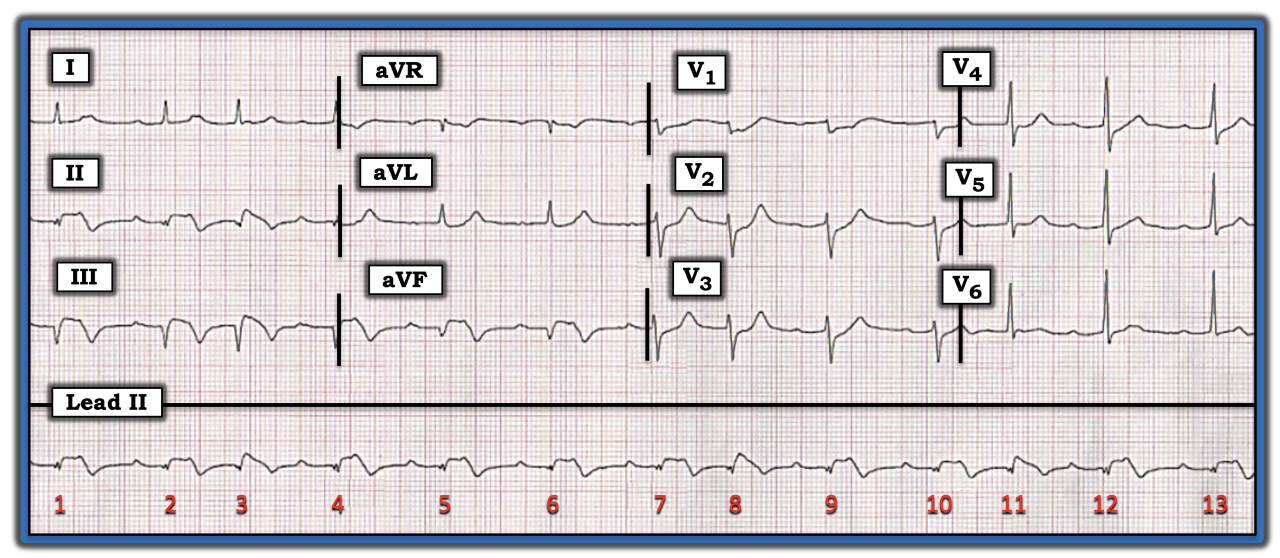
You are asked to interpret the tracing in the figure below without the benefit of any history. What do you think happened? How acute are these findings?
There are two principal parts to this tracing, which are the cardiac rhythm and ECG findings in the rest of the 12-lead. I always like to begin with at least a brief look at the rhythm. QRS amplitude in the limb leads is shorter, especially in lead II. This makes assessment of the long lead II rhythm strip especially challenging. That said, my eye was impressed by the presence of a pattern to the rhythm. That is, despite irregularity of QRS complexes, there were two main families of R-R intervals. Duration of the three shorter R-R intervals is the same (i.e., the R-R intervals between beats 2-3, 7-8, and 10-11), with a similar but longer duration for the remaining R-R intervals. This pattern of a “regular irregularity” is known as group beating. Clinically, it suggests some form of Wenckebach conduction may be present.
Continuing with assessment of the rhythm, the QRS complex is narrow; P waves are present (although some of these P waves appear to be partially hidden within the QRS or ST-T wave); and there is a repetitive and somewhat prolonged PR interval preceding beats 2, 4, 5, 6, 7, 9, 10, 12, and 13. I suspected the atrial rhythm was regular, but calipers would be needed to verify this.
At this point, I turned my attention to the rest of the 12-lead. Each inferior lead shows Q waves, ST elevation, and deep T wave inversion. The ST segment in lead aVL is scooped and slightly depressed. Chest leads show ST segment flattening and depression that is most marked in leads V1 through V4. T waves are surprisingly peaked in leads V2 and V3.
This 12-lead ECG is diagnostic of recent (if not acute) infero-postero infarction. In this clinical setting, by far the most common reason for the pattern of group beating seen in the long lead II rhythm strip is second-degree AV block of the Mobitz I type, also known as AV Wenckebach. Although the amount of ST segment deviation (elevation and depression) is significant, the finding of deep inferior lead T wave inversion with T wave peaking in anterior chest leads suggests there has been evolution with reperfusion occurring. This makes it likely the infarction is at least several hours old. Clinical correlation of the timing of symptom severity would help narrow the likelihood of this event.
For more information about and further discussion of this case, please click here.

You are asked to interpret the tracing in the figure without the benefit of any history. What do you think happened? How acute are these findings?
Subscribe Now for Access
You have reached your article limit for the month. We hope you found our articles both enjoyable and insightful. For information on new subscriptions, product trials, alternative billing arrangements or group and site discounts please call 800-688-2421. We look forward to having you as a long-term member of the Relias Media community.
