Those Anterior T Waves
By Ken Grauer, MD
Professor Emeritus in Family Medicine, College of Medicine, University of Florida
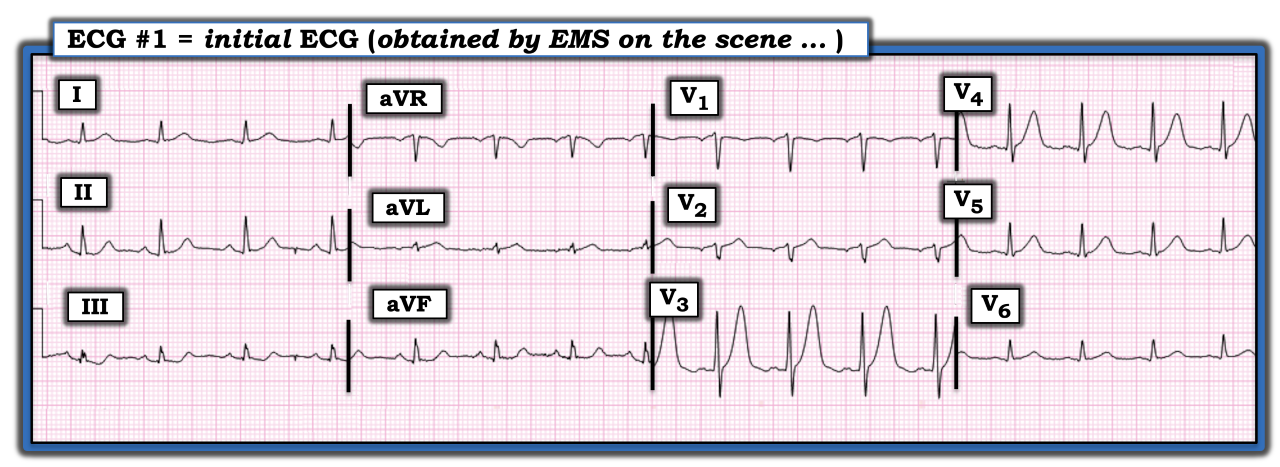
The ECG in the figure below was obtained from a man in his 60s who was seen in the field for new chest pain. How might one interpret this tracing?

There is sinus arrhythmia at a rate close to 100 beats/minute. Intervals PR, QRS, and QTc, along with the axis, are normal. There is no chamber enlargement. Regarding Q-R-S-T changes, there are small (probably insignificant) q waves in the inferolateral leads. Although transition (where the R wave becomes taller than the S wave is deep) occurs appropriately between leads V2 to V3, R wave progression is unusual in that there is an abrupt change from predominant negativity to predominant positivity. I suspect the lead V2 electrode may be malpositioned, which is relevant given the abnormal ST-T wave findings in neighboring leads.
The most remarkable abnormality is the exceedingly tall and peaked T wave in lead V3 (that is even taller than the 12 mm tall R wave in this lead). In a patient with new chest pain, this is a “hyperacute” T wave. Although not quite taller than its corresponding R wave, the T wave also is much taller and more peaked than expected in neighboring lead V4.
ST-T wave abnormalities are present in several other leads, albeit the changes are subtler. These additional subtler abnormalities include a T wave that probably also is hyperacute in lead V5, nonspecific ST segment flattening in leads III and aVF, and a T wave that probably is hyperacute in lead aVL (considering how tiny the QRS complex is in this lead).
This is an extremely abnormal ECG. The hyperacute changes in the anterior leads resemble deWinter-like T waves. In association with the subtler ST-T wave abnormalities in multiple other leads, this all strongly suggests acute left anterior descending (LAD) coronary artery occlusion. An acute, proximal LAD occlusion was found on cardiac catheterization.
For further discussion of and more information about this case, including step-by-step laddergram illustrations, please click this link.
The ECG in the figure was obtained from a man in his 60s who was seen in the field for new chest pain. How might one interpret this tracing?
Subscribe Now for Access
You have reached your article limit for the month. We hope you found our articles both enjoyable and insightful. For information on new subscriptions, product trials, alternative billing arrangements or group and site discounts please call 800-688-2421. We look forward to having you as a long-term member of the Relias Media community.
